Good points. I've been wondering that as well.
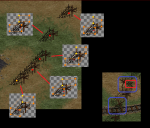
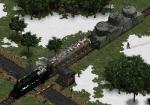
Over this weekend, I've been going over the original graphics, been compiling them. There's over 13.000 of them, across the BEL missions (main missions and training missions) and the BCoD missions combined. I've made a master graphics directory, by simply copying everything in chronological order of WAD files into a single directory; first BEL, then BCoD. I am currently in the process of going over them all to figure out the real (i.e. identical graphics) and the fake (i.e. different graphics, but same name) duplicates. With 13k images, that's a daunting task, but I've imported the full name listing in Excel, which helps truckloads to identify all those duplicates. I keep track of the FASE source for each file in that list, where I renamed the BCoD source from FASE000x to FASEE00x to distinguish them from the BEL missions. So far, I've analysed about 9.000 out of the 13.000 images.
Once that task is completed, I can see about analysing the various VOL files and categorize the following entries for each of the graphics files mentioned there:
- If they have points and if so, what they are;
- If they have a radius and if so, what it is;
- The offset between the graphics file and the polygon;
- Mirroring in X and Y direction (and its effects on these offsets);
- Association with other graphics files (as some polygons have multiple tiles)
Not all graphics files have these (for instance, the basic land and water tiles don't have them), so I expect a somewhat smaller list than 13000 expanded entries  . For a number, I do expect multiple entries with regards to the points (as I already found out with that barbwire fence in the villa mission), so in those cases it's a matter of making a choice.
I plan to make the Excel code in such a way that it can import and export the files in both VOL format as well as CME format - though I need to explore that one somewhat further, as its layout differs from the VOL files and not all entries in that file are clear to me at this moment.
I suspect once this task is done, it might be worth it to personally make some custom graphics which logically combines a few, mostly for the buildings. As it is, I've already found a trio of wall graphics, which occur within a single polygon and aren't used anywhere else. Why they used three graphics files there instead of one is a mystery to me. Then again, the more I am analysing these graphics, the more I am wondering how crude their approach has been on this aspect. Anyway, it should be easy to add the points of these custom graphics to the Excel file once made. Adding them is a one-time chore for a lifetime ease of adding them automatically instead of manually  .
.
Update: Completed the scan of all doubles. Of the roughly 5800 duplicates, only some 4000 are real duplicates. Of those, some 2200 would need to be renamed to give all files a unique name. On the other hand, Windows has already added a (2), (3), etc ... to the filename, so I might just hang on to those. Probably also a lot easier when other people are possibly going to use it. Will just need to keep track of that in the macro code I am going to write.
Next step is to write that macro code which is going to gather all the POINTs and such from the VOL file for each graphics file that has them.
Edited by Maurice1976, 11 September 2017 - 09:21 PM.

 Bunkers.zip 8.13MB
710 downloads
 Pilot.zip 3.1MB
548 downloads
Pilot.zip 3.1MB
548 downloads![]()


